TOOLS

SHINY APPLICATIONS

Shiny applications developed by members of the Amsterdam Science Park Study Group. These applications run in the cloud on the shinyapps cloud infrastructure.

If interested to host your own application on our Shinyapps server, please contact Joachim Goedhart (J.Goedhart@uva.nl).

Applications are listed by their name in alphabetical order together with a quick description.

Birdradar

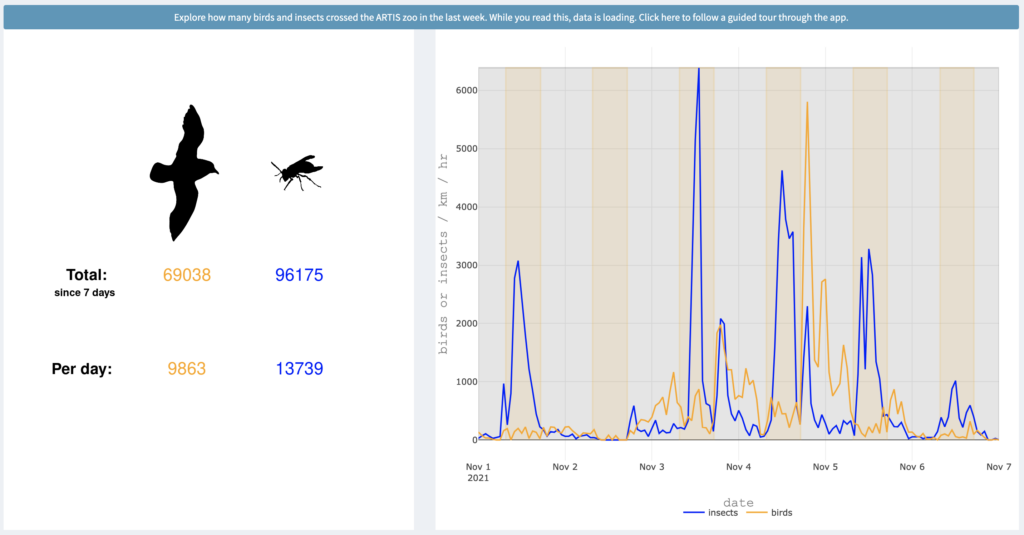
With this application, you can explore live hourly estimates on the number of birds and insects which flew over the ARTIS zoo (across a transect of 1 km) over the last 7 days.

⚠️ Two versions of the application are available. One is designed specifically for smartphone while a more complete version exist for laptops. All versions work best with the Chrome web browser.

💻 Laptop edition link:
https://amsterdamstudygroup.shinyapps.io/birdradar/

📱 Smartphone edition link: https://amsterdamstudygroup.shinyapps.io/birdradar_smartphone/
To access the tool you need to scan a QR-code with your smartphone (QR-code is added in the laptop edition).

This application was developed by Johannes De Groeve, the data manager of IBED, member of the institute’s Computational Support Team. 

ggPlotter

ggPlotteR was developed to demonstrate how ggplot2 can be used to encode a data visualization, line-by-line. After generating the plot, the R-code can be retrieved and directly used in R to (re-)create the plot.

Link: https://amsterdamstudygroup.shinyapps.io/ggPlotteR/

ImageQuiz

ImageQuiz is a game that tests the correct identification of images
An image and several words or short sentences that describe the image are shown. Users should choose the option that most accurately describes the image. In case of a correct answer, the next image is presented. An incorrect answer results in a note and the user can try again. The number of correct and total answers are shown as a score.

Link: https://amsterdamstudygroup.shinyapps.io/ImageQuiz/

PlotsOfData

The PlotsOfData Shiny app plots the data and selected statistics to enable the comparison of (experimental) conditions. The philosophy of the approach is that plotting the raw data (instead of a summary) improves transparency and interpretation. To further facilitate the comparison, summary statistics (mean, median, boxplot, violinplot) and inferential statistics (confidence intervals) can be added. The user has full control over the visibility of the raw data and statistics by adjustment of the transparency (alpha). More details about the PlotsOfData app can be found in the publication

Link: https://amsterdamstudygroup.shinyapps.io/PlotsOfData/


PlotTwist

PlotTwist is developed for visualizing data from time-lapse imaging but can be used for any type of continuous data. It features several visualizations, including the small multiple and heatmap. See more in the publication

Link: https://amsterdamstudygroup.shinyapps.io/PlotTwist/


PlotXpress

PlotXpress is a Shiny app for processing and visualizing data from from dual-luciferase expression assays. The app directly reads the output data from the Promega GloMax©  reader. In addition, it accepts data in a tidy format. It uses the renilla signal for normalization of expression data and plots the relative expression grouped per condition and for different treatments.

See more in our publication

Link: https://amsterdamstudygroup.shinyapps.io/PlotXpress/

SuperPlotsOfData

SuperPlotsOfData is an extension of PlotsOfData that enables the identification of data from replicate experiments and their analysis. The summary data from the replicates is used for the quantitative comparison of conditions.

See more in the publication

Link: https://amsterdamstudygroup.shinyapps.io/SuperPlotsOfData/


VolcaNoseR

VolcaNoseR is a Shiny app is for generating volcano plots and nosing around in the plotted data. The app allows user-defined cut-offs for the fold-change and significance. Lists with top candidates are shown and these can be annotated in the plot. In addition, user-selected candidates can be added as labels to the plot. See more in the publication

Link: https://amsterdamstudygroup.shinyapps.io/VolcaNoseR/