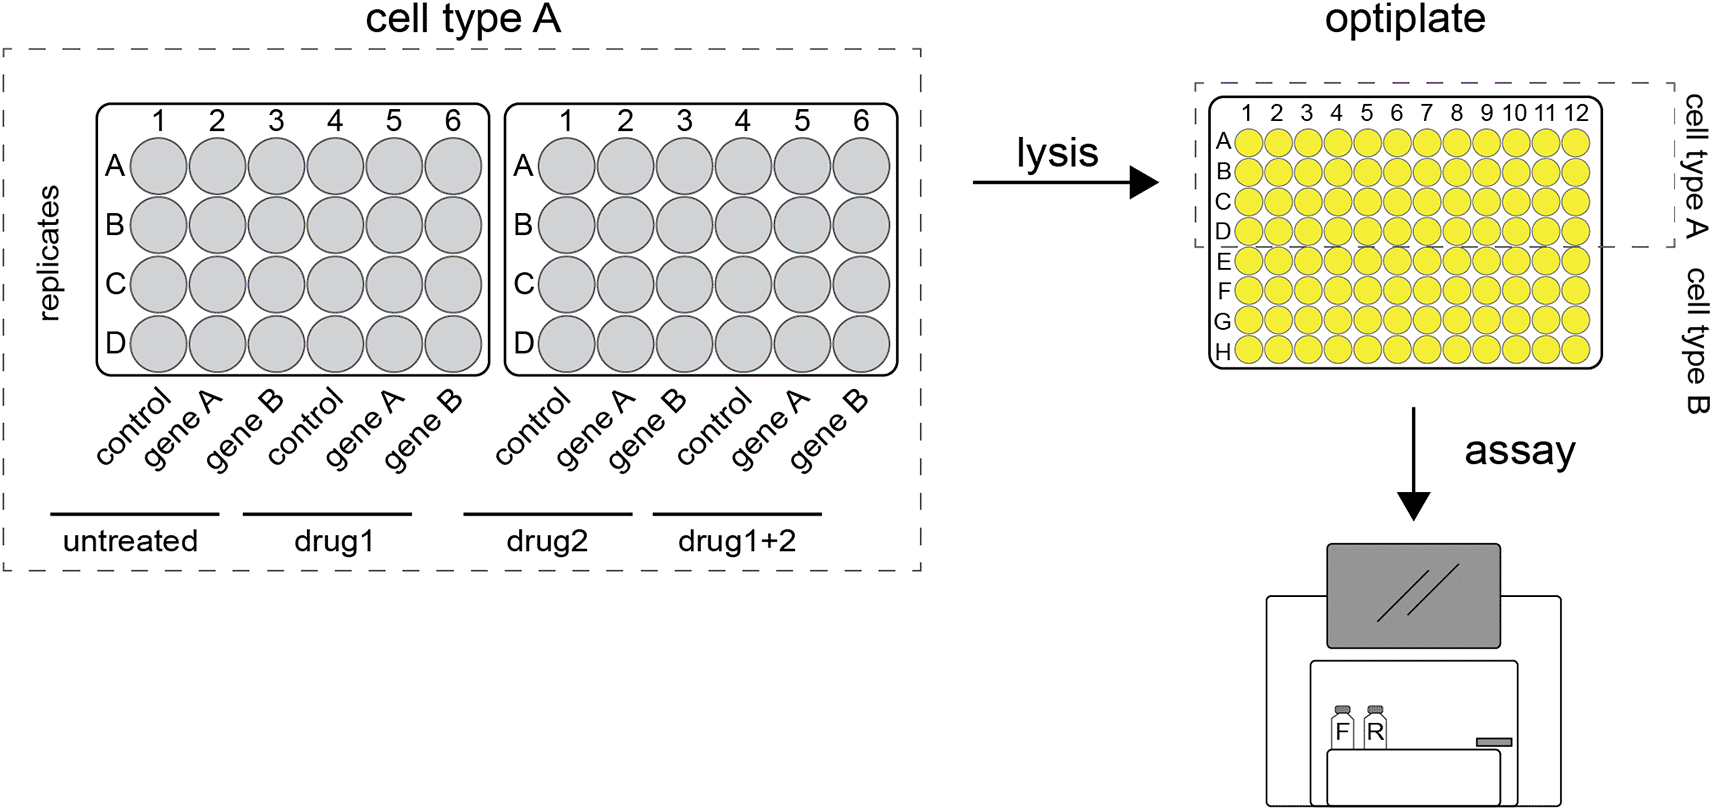
After attending a workshop that was organized by the Amsterdam Science Park Study Group, Elias Brandorff (Evolutionary Neurogenomics) contacted Marc Galland (Plant Physiology) to discuss how to improve the data processing and visualization of experimental results from gene reporter assays.
The common procedure to analyse data was by copy-pasting in Excel sheets (sounds familiar?), requiring a lot of manual actions. As a consequence, the analysis is not reproducible and prone to errors. To solve this, an R-script was put together and Joachim Goedhart (Molecular Cytology) was involved to implement the R code as a R/Shiny app. The result of this collaboration is a freely available webtool ‘PlotXpress‘ that provides a user-friendly and reproducible way to analyse the data from dual-luciferase assays.
A companion paper is published in the F1000Research Open Research publishing platform:
Brandorff E, Galland M and Goedhart J. PlotXpress, a webtool for normalization and visualization of reporter expression data [version 1; peer review: awaiting peer review]. F1000Research 2021, 10:1125 (https://doi.org/10.12688/f1000research.73641.1)